

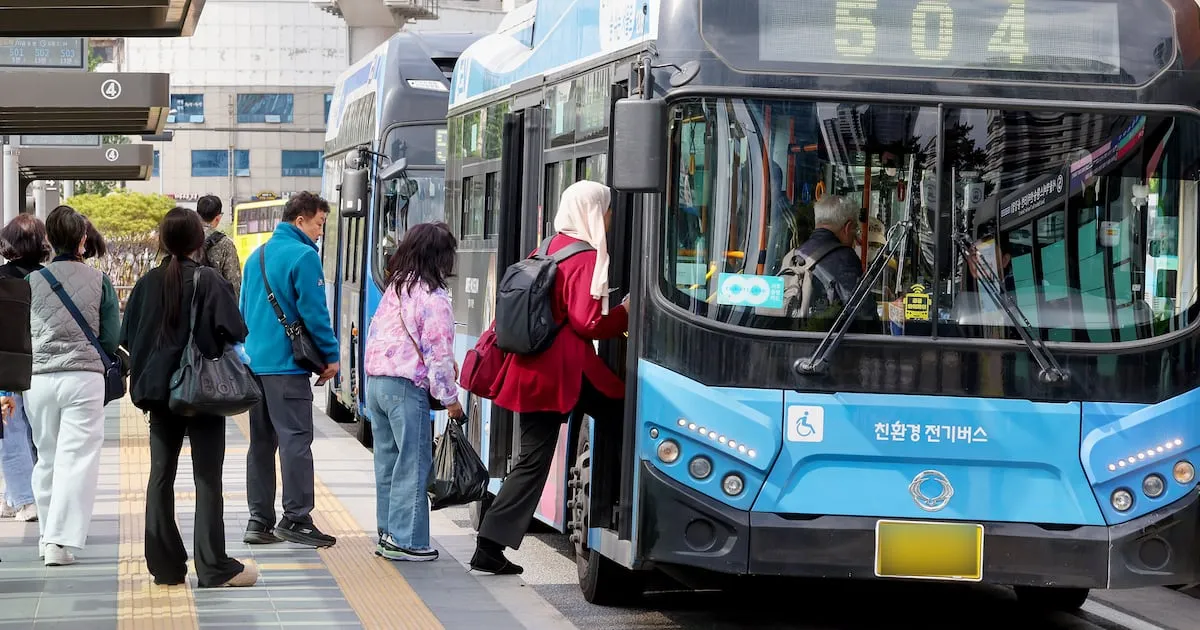
The efficiency of public transportation compared to private cars varies dramatically across South Korea, with some regions offering competitive travel times while others lag significantly. A recent study analyzing urban mobility revealed that while Seoul boasts the shortest time difference between public transit and car travel, areas like Chungnam province require nearly two additional hours to reach destinations by public transport compared to driving.
Understanding the Public Transit Competitiveness Index (PCTR)
Researchers from the Seoul Institute’s Smart Transportation Research Division introduced the Public Transit Competitiveness Index (PCTR) to quantify this disparity. The PCTR measures how much longer public transportation takes compared to private cars for the same journey. A PCTR of 1 indicates that public transit and car travel times are equal. As the PCTR increases, it signifies a longer travel time for public transit relative to driving. A lower PCTR suggests that public transportation is more time-competitive.
The study, detailed in the report ‘Analysis of the Relationship Between Urban Indicators and Public Transit Usage,’ examined travel routes across South Korea’s 17 major cities and provinces. Researchers identified key administrative centers as primary destinations and analyzed at least 25 travel routes within each region. Using navigation data from Naver Maps for identical dates and times, they compared the optimal travel times provided for both private cars and public transit, then calculated an average PCTR for each area.
Seoul Leads in Public Transit Efficiency
Seoul emerged as the leader in public transit efficiency, with a PCTR of 1.21. This means that for a journey taking one hour by car, public transit in Seoul takes approximately 1 hour and 12 minutes. This relatively small time difference highlights Seoul’s well-developed public transportation infrastructure, including extensive subway and bus networks that allow for efficient movement across the city.
Following Seoul, Busan showed the next lowest PCTR at 1.46. A journey that takes an hour by car in Busan averages about 1 hour and 28 minutes using public transit. Other major cities also demonstrated relatively good performance:
- Incheon: 1.54
- Gwangju: 1.76
- Jeju: 1.77
- Gyeonggi: 1.82
- Daegu: 1.97
- Gangwon: 2.00
These figures indicate that while public transit is generally slower than driving in these cities, the time penalty is manageable, suggesting a reasonable level of service and network coverage.
Chungnam Province Faces Significant Public Transit Delays
In stark contrast, Chungnam province recorded the highest PCTR at 2.88. This implies that a trip taking one hour by car could take nearly three hours (2 hours, 52 minutes, and 48 seconds) via public transportation. This substantial difference points to significant challenges in public transit accessibility and efficiency within the province.
Other provinces also showed considerably higher PCTRs, indicating a broader trend of public transit lagging behind private cars in non-metropolitan areas:
- Jeonnam: 2.66
- Jeonbuk: 2.36
- Chungbuk: 2.35
- Ulsan: 2.20
- Gyeongnam: 2.19
- Gyeongbuk: 2.13
- Daejeon: 2.05
The data clearly illustrates a divide between major metropolitan areas and provincial regions. Special cities and metropolitan cities generally maintained PCTRs below 2, reflecting denser infrastructure and more frequent service. However, many general provincial areas exceeded this threshold, suggesting that public transit is a less viable option for timely travel in these regions.
Factors Influencing Public Transit Usage
The Seoul Institute’s analysis suggests that the density of urban functions and the resulting comprehensive public transit infrastructure in major cities contribute to shorter travel times. The study also found a correlation between higher PCTRs and lower public transit usage rates. When public transportation consistently takes longer than driving, citizens are less inclined to use it.
Conversely, areas with a higher density of subway stations and bus stops, and more frequent bus routes, tended to see higher public transit utilization. Other demographic and socioeconomic factors also played a role:
- Population Density and Commuting: Cities with higher population density and a larger proportion of their population commuting to work showed increased public transit shares.
- Elderly Population: Regions with a higher percentage of elderly residents exhibited lower public transit usage rates. This could be attributed to mobility challenges or a greater reliance on private vehicles among older demographics.
International Comparisons and Policy Implications
Similar trends were observed in international urban areas, reinforcing the study’s findings. For instance, in Melbourne, Australia, a 10% increase in subway stations per unit area was associated with a 4.1% rise in public transit use per capita. In Salvador, Brazil, a 15% improvement in PCTR was projected to increase public transit ridership by 13.1%.
The research team utilized data from 91 cities across 55 countries, in addition to South Korea’s 17 regions, examining factors such as population, economy, and transportation infrastructure. They also considered the impact of living costs, public transit infrastructure, travel time by different modes, and private car regulations on public transit ridership.
The researchers concluded that urban policies should be tailored to the specific characteristics of each city. Instead of a one-size-fits-all approach, strategies should consider a city’s structure, population traits, and the level of its transportation infrastructure to effectively boost public transit demand and efficiency nationwide.
